EUGLENAS
The Euglena gracilis are unicellular micro-organisms
about 50 micrometers in length which can swim at a speed
of about 100 micrometer/second. Below are some movies which
show their movements.
(1) FILMS SHOWING EUGLENAS IN MOVEMENT
(a) In 2 dimensions (low magnification)
Film eug4a.mov. Euglenas between slide and slip cover
(2-dimensional motion, duration=77s)
Film eug4a.mp4. Same film as above but in mp4
format
Film eug4a.gif. Same film as above but in gif
format
The conclusion that it is a 2-dimensional system can be confirmed
by the fact that
two euglenas never really cross one another at right angle. Sometimes
the ends of their bodies can be seen to overlap but the
entire bodies never cover one another.
Advice
If none of the 3 previous formats can be opened by your
computer (notice that a right click may enable you to select
the appropriate sofware), you can convert the film
into other formats on the following website:
http://video.online-convert.com/
(b) In 2 dimensions (high magnification)
Film eug10a.mov. Euglenas between slide and
slip cover
Film eug10a.mp4. Euglenas between slide and
slip cover
This film is similar to the previous one but with a magnification
that is 2.5 times larger. Again one sees that the euglenas
do not cross one another at right angle.
FILM: Same film as above (format: gif)
(c) In 3 dimensions
Film ftd.mov. Euglenas in a drop (3-dimensional
motion)
Film ftd.mp4. Euglenas in a drop (3-dimensional
motion)
Of course, those euglenas which, at a given moment, are not in the
focal plane will appear as out of focus grey spots. The more distant
they are from the focal plane, the more blurred their image will be.
One sees many cases where the trajectories of two euglenas
intersect but they are at different levels.
The image of one of them (which is in the focal
plane) is sharp
while the image of the other (which is above or below) is fuzzy.
(2) EUGLENAS FORMING A CLUSTER
FILM (10Xd.mov): transition zone between a cluster and the surrounding
population
(3) VELOCITY DISTRIBUTION
The following graphs show the velocity distribution of the
euglenas at 3 different densities; from left to right
the density decreases: 17 euglena/sq-mm, 5.3 and 2.2.
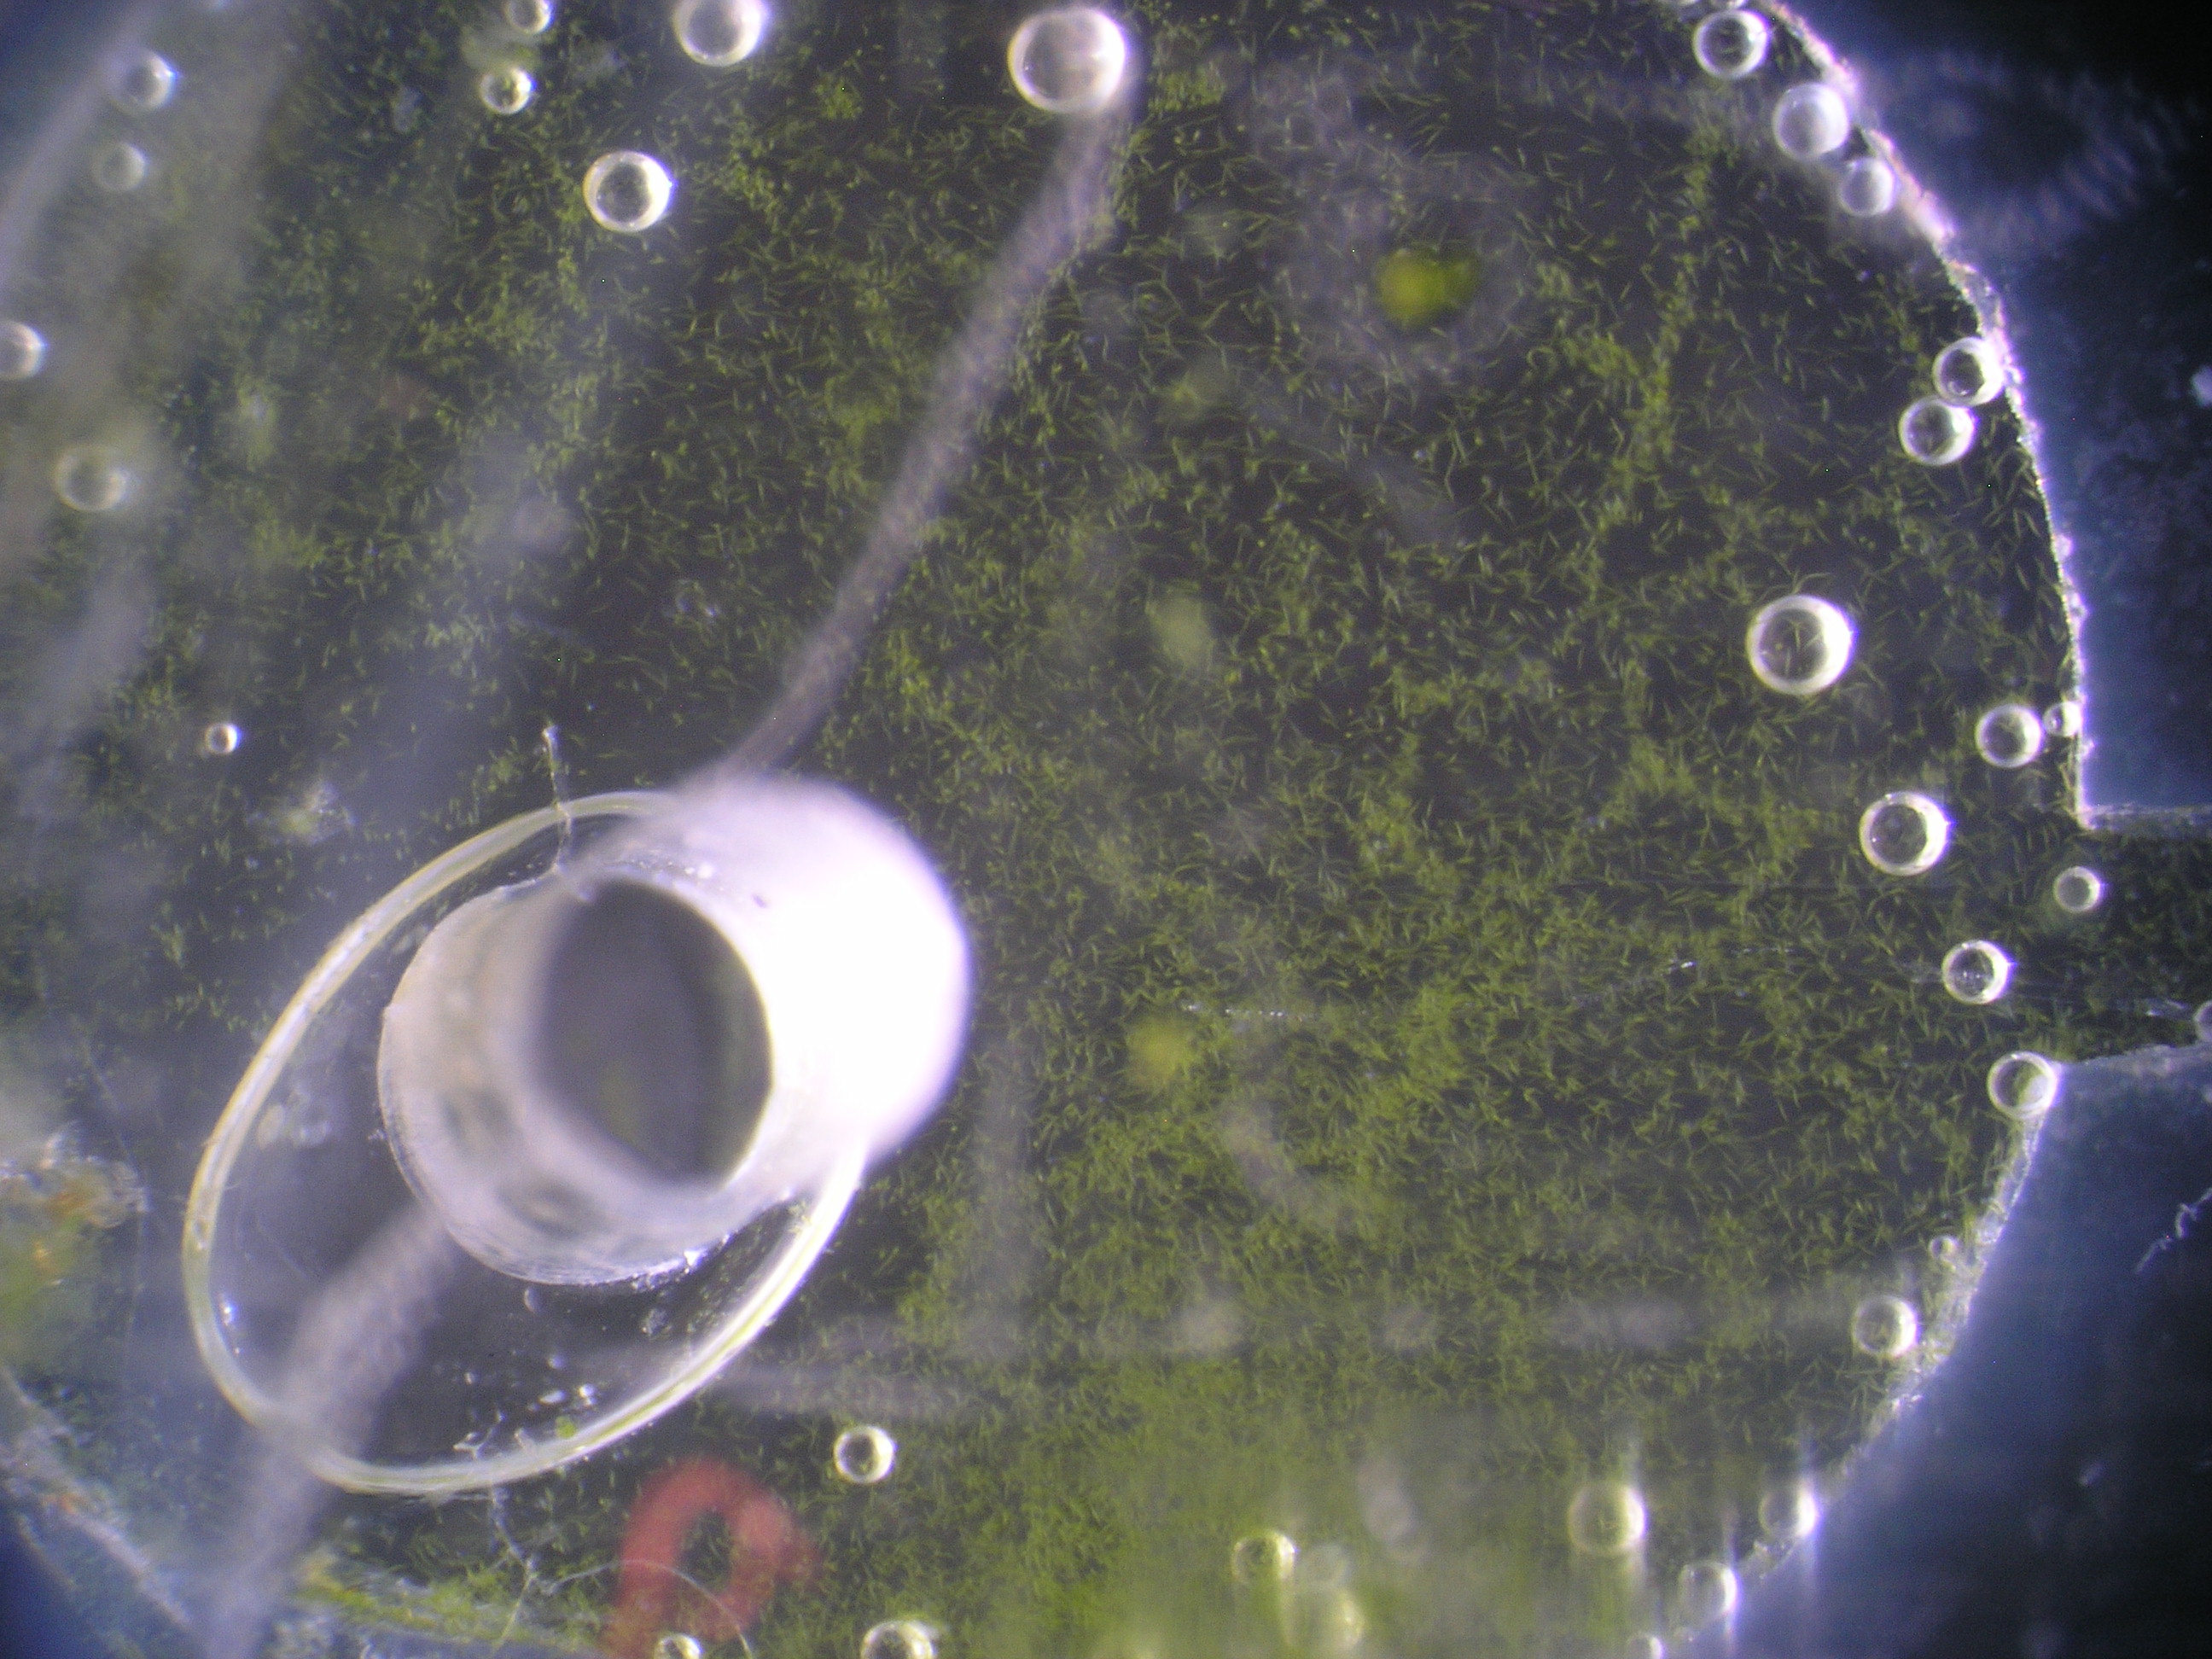
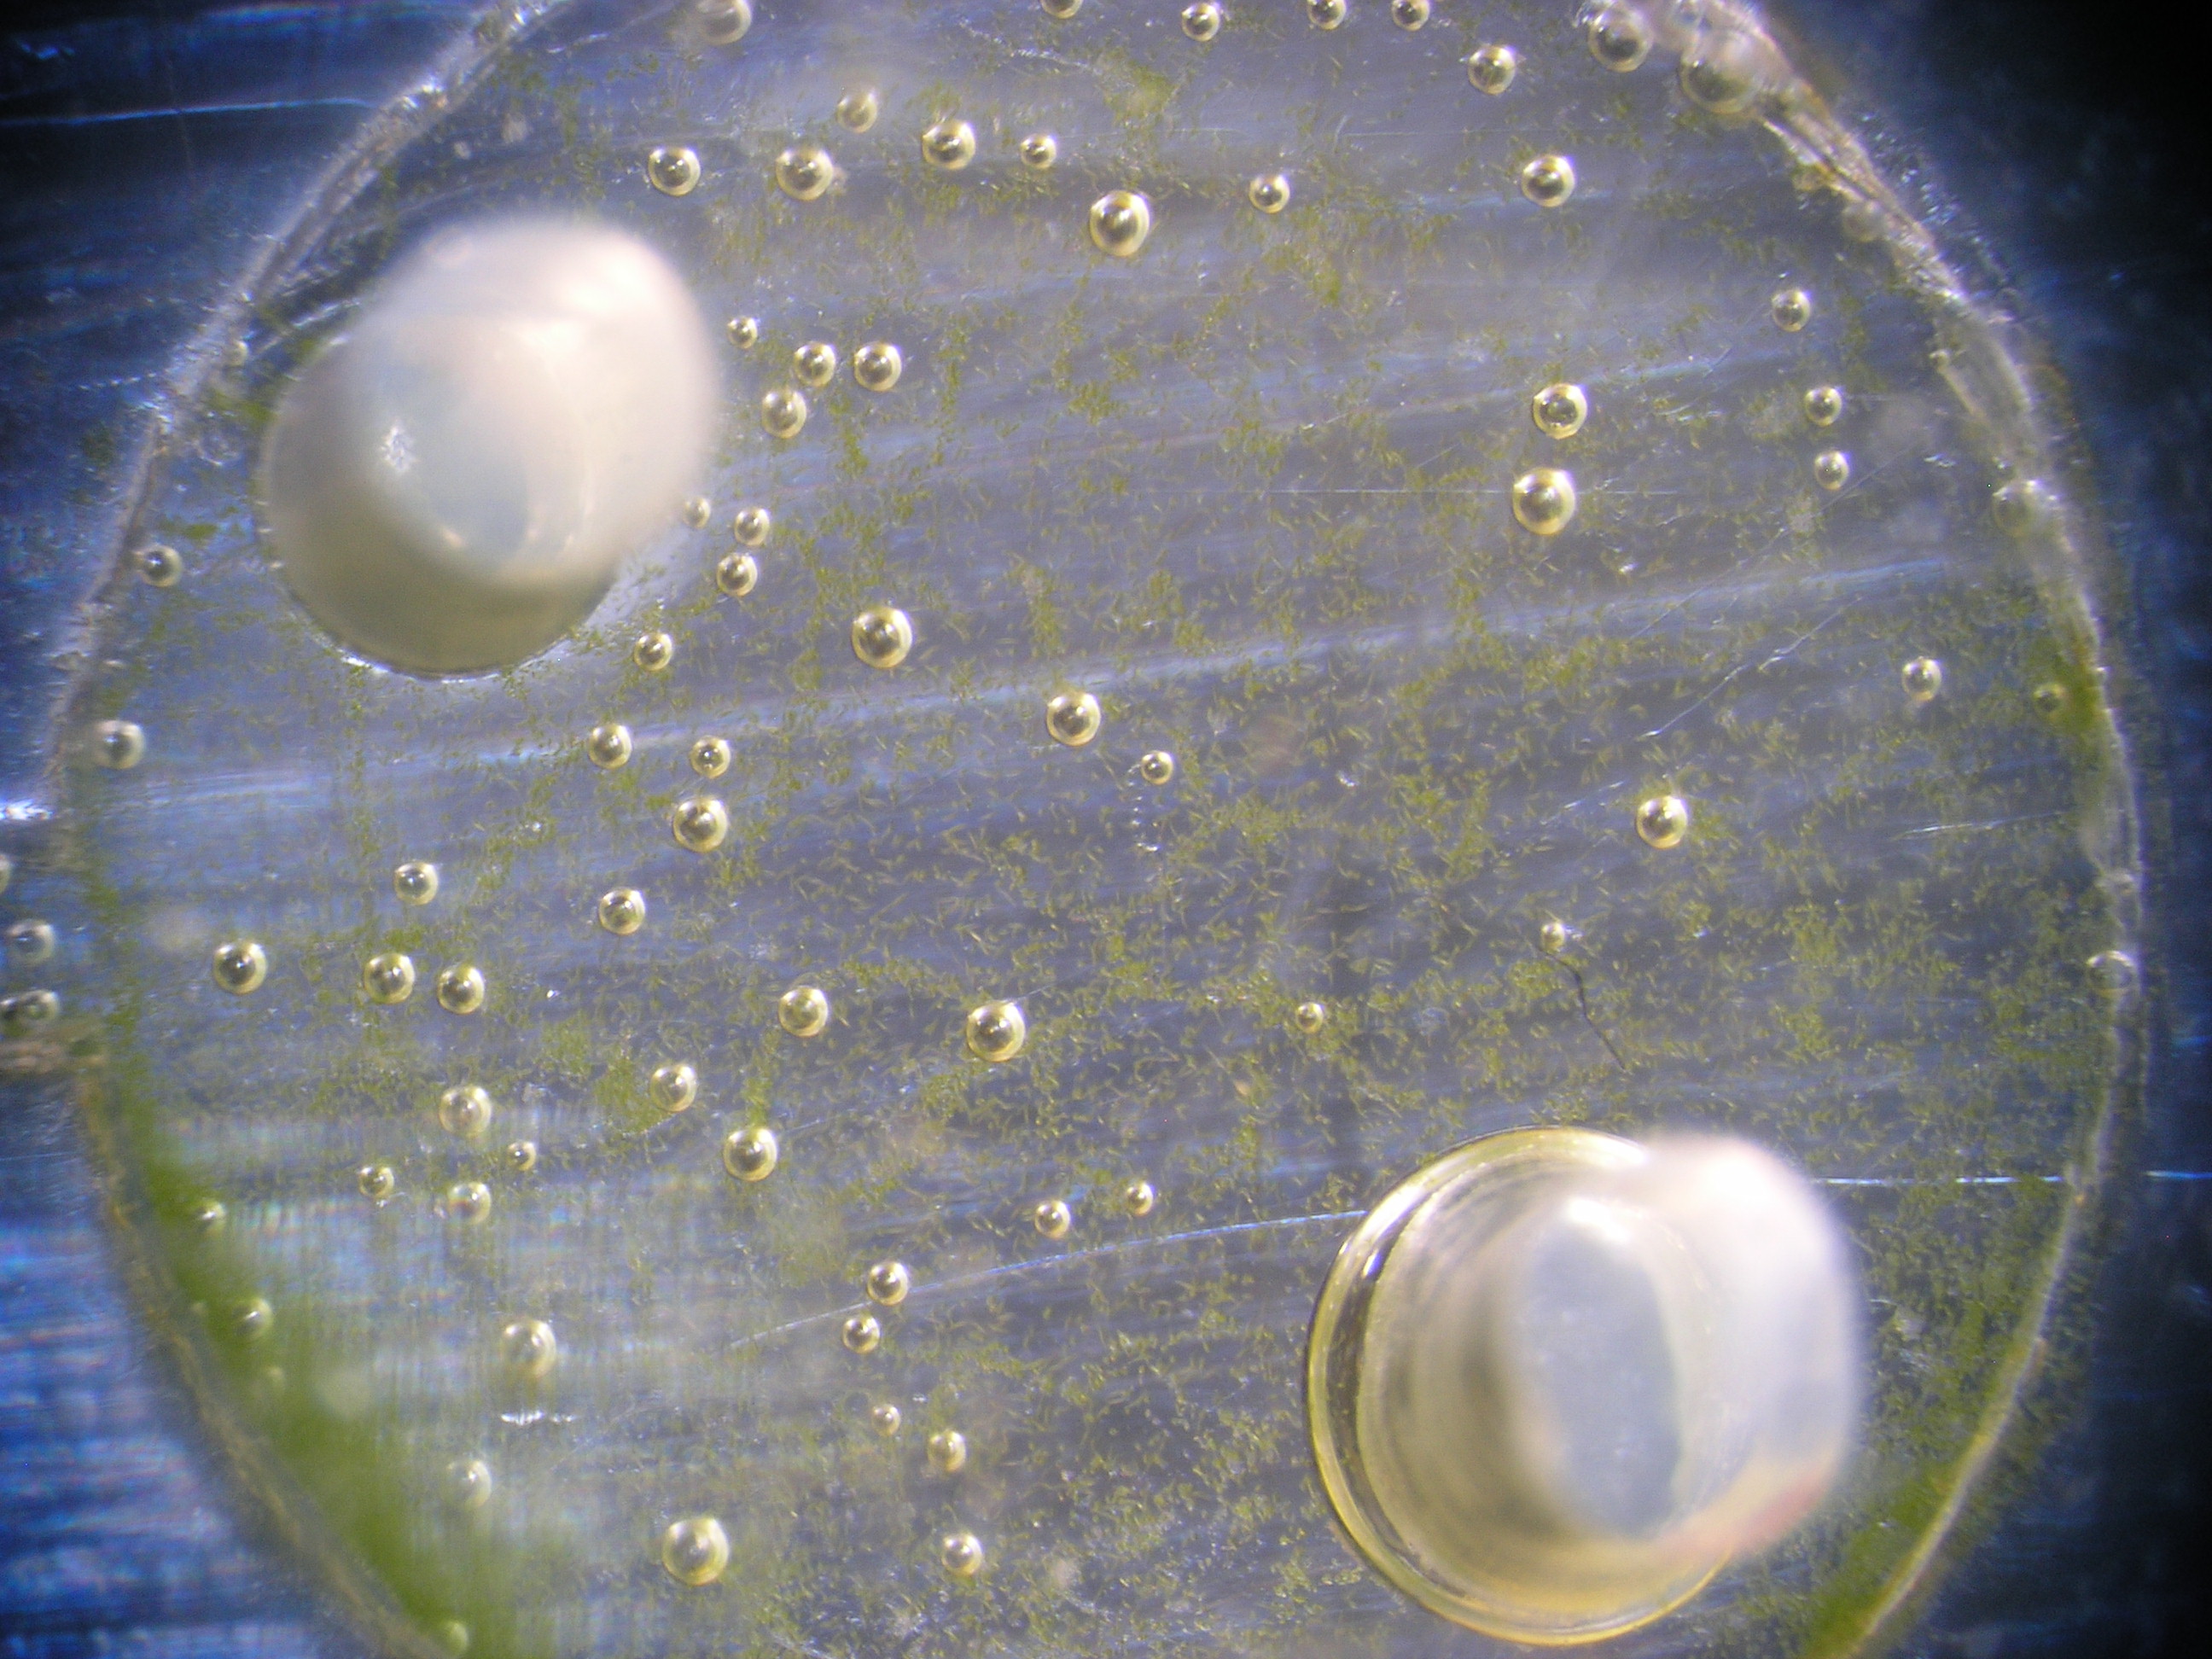
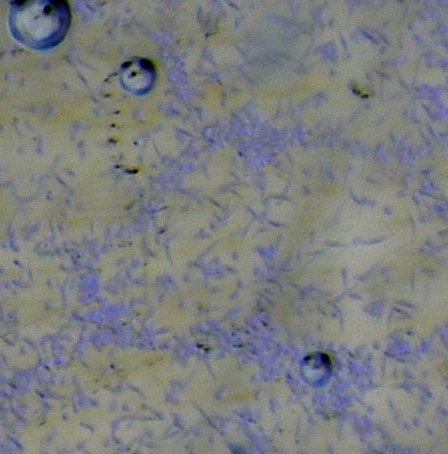
(4) LATTICE FORMATION OF EUGLENAS
FILM (10Xd.mp4): transition zone between a cluster and the surrounding
population
In this experiment the euglenas were confined within a thin
(the thickness was about 80 micrometers) layer of water
surrounded in the x-y plane by a roll of oil and
comprised in the z-direction between two thin glass plates
(slide and slip cover).
The purpose of the roll of oil is to
prevent evaporation. Without it evaporation of the water
precluded any observation longer than about 5mn.
The cluster was brought about by increasing the intensity of the
light directed from above. The cluster did not appear within
the disk where the intensity was highest but on a darker zone
at its periphery. The experiment could be reproduced almost
identically; the formation time of the cluster was always about
5mn.
This experiment was performed in the group of Prof. Michel Gho
to whom we express our gratitude.
Not surprisingly, one observes that the average velocity
decreases when the density increases. More interesting
is the variation of the coefficient of variation, i.e. the
standard deviation divided by the mean.
However, to get a clearer view
additional experiments are required.
Velocity distribution of euglenas
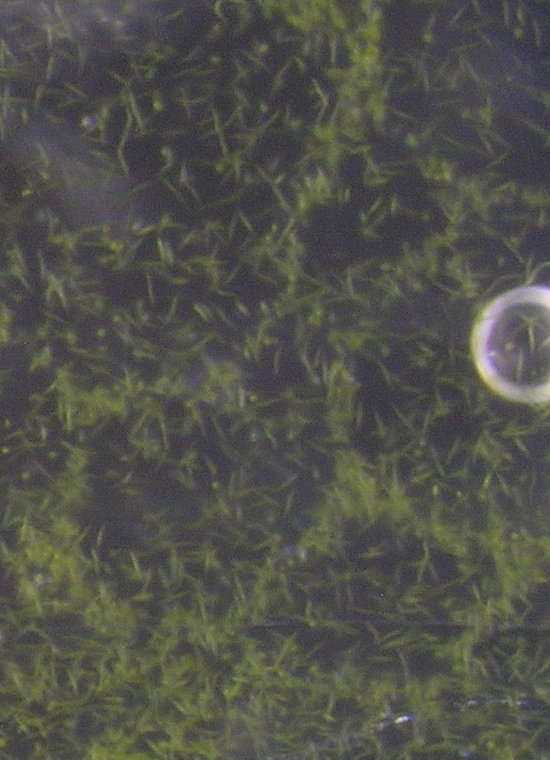
In this experiment the euglenas were confined in two connected
disk-shaped areas. The depth of the water was 0.5mm. The euglenas were
kept in darkness (except of course when the picture was taken).
The lattices on each side appeared about 30mn after the euglenas had been
introduced into the pool.
Same lattice magnified